This article is also available as a podcast
Considering a few different versions to your landing page? Not sure about the color of the background? Hesitating between a few options of text copy on the home page?
A multivariate test/ Ab test (a.k.a. split test, website checking) can be the answer for you. With ab testing you don’t have to shoot in the dark; you can perform a test to optimize your website even with a small budget, and find which version of your website performs best.
There are several platforms in the market that offer a one-stop-shop to a/b and multivariate testing, and most of them are not cheap, so in this post I will describe how to do it yourself to avoid these costs.
The do-it-yourself method uses Google content experiment as the test platform for either ab testing or multivariate testing and is free – the only costs associated with the tests described below are the costs of designing and operating the website and the cost of getting website traffic (bringing visitors to the site). In addition to minimizing costs, you will also learn a lot from the process of running such a test on your own.
The experiment phases are roughly the following: define goals and metrics, choose variables of interest, design the website and experiment, execute and collect the data, analyze, derive conclusions.
Follow the steps below to create an awesome A/B or multivariate experiment:
#1 – Define Goals and Metrics
How will you know which design/website version is the best?
You have to define goals according to what you want people to do on the site. For example, do you want people to subscribe to newsletter? Purchase a product? Do you want to maximize number of pages viewed per visit? Maximize time on site?
It is important to define these metrics well since this is a live, online experiment, and we cannot ask visitors to describe their website experience. We rely on tracking software to provide information regarding the behavior of the visitors on site. This information later allows us to compare the behavior between the different variations, but we need to be very clear about what’s we are measuring. Think about it – if your goal is to make a sale, do you really care how much time people spend in your site if they didn’t purchase anything?
Some metrics that you can look at are:
- Time spent on page
- Number of pages viewed
- Click on the purchase link/checkout
- Add item to shopping cart
- Subscribe to newsletter
- Share article
- Like page
- And more
You can also record data about the visitors such as time, region, browser, device, and in some cases – additional demographic details.
#2 – Variable Choice
Choosing variables is one of the hardest parts of the experiment planning; each website contains countless elements that could be affecting the visitor experience. Since testing all the elements present in a website can take forever, you have to come up with your priorities and variables of interest.
Even though you should decide on the variables before starting to build the websites and running the experiment, keep an open mind and be willing to change things on the go. When data starts flowing in, you may realize that some variables you chose provide little insight, while other elements you didn’t include hint at interesting results.
There are infinite options for variables to test. Some ideas are:
- Background color/design
- Different titles/slogans
- Different text copy
- Different settings of elements inside of the page
- Social endorsement icons
- Presence of a video
- Flash versus HTML
#3 – Website Design
After you planned the experiment and chose variables it is time to design the websites.
It is important to make sure that other than our special variations, the design of the website remains standard and appealing to the visitor. There are many tools and platforms out there for website creation with varying degrees of flexibility, I suggest you do your own research and find the software that matches your technical skills. One suggestion for a very intuitive website design software is Artisteer. A trial version can be downloaded here.

Designing my sites with Artisteer website design software
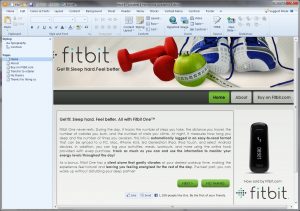
Let’s look at an example of what I mentioned so far, so you best understand how to design the different versions of the site.
Say that I’m interested in testing the effect of the following variables on visitor engagement:
- The main element on the landing page: text versus video versus image on the home page.
- The size of product seller – big/small (this is an affiliate website which leads to a checkout page for the product on either Amazon.com or Fitbit.com, Amazon.com is obviously the big famous retailer)
- The presence of a Facebook like button showing over 1,000 likes for the product.
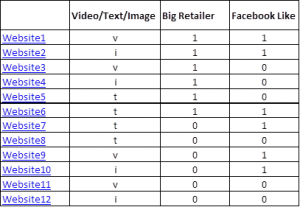
This choice of variables dictates building 12 websites, as described in the table below. 3X2X2=12 : three variations for main element of landing page, to variations for retailer size, to variations for presence or absence of a Facebook like button.

As described in the table, I designed 12 websites using Artisteer software. Each website is a slight variation of the other. Here are a few samples, click on any of the images below to enlarge the variation.

#4 – Tracking Website Visitors
In order to follow visitors’ behavior on the website, I worked with three tracking services, each one complementing the other: Google analytics, opentracker.com, and Web-stat.net. Each of these services provides a tracking code that is then implemented into the HTML files of the site after the design is ready. Adding the code is pretty straightforward and is explained on each one of the tracking platforms after you open an account.
Google analytics is good if you’re looking for overall performance and don’t care too much about statistical validity, but is very limited if you want to run your own statistical analysis with the data and need the records of each specific visit (this is because of current privacy settings in Google).
Opentracker web tracking tool
If you’re interested in performing a more professional statistical analysis (recommended) that will check if the results you’re getting are significant at all, you need to collect individual website visit stats. Both Opentracker and Web-stat provide detailed individual visitor stats – as well as click paths (=the exact sequence of clicks a visitor goes through in your website). An even more advanced option is Clicktale, a service that actually records each movement of the courser, scrolling, etc. and provides a heat map, showing you what parts of the landing page page were most visible to your visitors.
After pasting the tracking codes into the site’s HTML, I uploaded the website files to my hosting server. To check that the tracking codes work, I visited each one of the 72 experiment pages (each website had six pages, thus 6X12=72), and logged in to the tracking software to verify that all my visits were tracked.
After verifying that the tracking code works well, the next step is to get visitors to all the different sites.
#5 – Getting Website Visitors to All the Variations
The fastest way to bring “real” website traffic is through online advertising campaign. A common one to use is the Google search / display network advertising, but there are other options available through Yahoo, Bing, and more.
Those ads, a.k.a Adwords appear when relevant queries are typed into search engines, or in text boxes in relevant websites. You pay only when a visitor clicks on the ad and gets to your website (this advertising system is known as known as PPC, or pay per click). There are plenty of AdWords tutorials on the AdWords website and on YouTube, check them out when you are ready to start bringing traffic to your website.
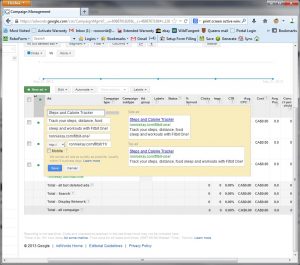
Below is a screenshot of the AdWords ad I used for the sample:

Since we have 12 different websites, we want to be able to send visitors to 12 different URLs. How do we do that?
There are two main methods to do this:
The first method is to create 12 ads which are identical in content, but each one leads to a different URL. In campaign settings, choose the option of “rotate ads evenly”, which will ensure that the ads will be served approximately equally. This however, does not ensure that the number of clicks will be even – it is possible that by chance one of the ads will be clicked more than the other. This limitation is eliminated by the second method – opening a Google experiment.
A Google content experiment allows you to randomize the page to which the visitors arrive. Simply put, you show all of the visitors a URL that leads to “websites 1”, but Google randomizes the page they actually see – some of them will see “websites 2”, some will see “website 7”, etc. A cookie will be stored in the visitor’s browser ensuring that each visitor always sees the same page if they later returned to the site.
In addition to randomizing the sites, Google content experiment allows you to set specific targets to compare the different website variations, using metrics such as: predefined conversions, number of pages viewed, time on site, etc. You can define, for example, that a visitor who spent more than 60 seconds on your site is considered to be a “success” and Google content experiment will compare the different variations according to this metric.
Using this method requires adding a few more lines of HTML to the website, yet the code is fully provided by Google and you just have to copy and paste it into the site’s homepage.
Q: should I use my twitter/Facebook/email to promote the site and get visitors without paying for a service like Google AdWords?
A: at this point absolutely not. You want to the get real reaction of visitors – people who don’t know you, don’t care about you, and are judging your product through what they see on your webpage. Thus, sending your site to people you know could be beneficial only in one of two stages:
- Before you conduct the experiment, you show the website to a few people and ask them what they think. You can use their answers to plan the experiment’s variables. For example, if one person tells you that the background should be black and another person says that the background should be orange, you can use these two suggestions as variations in your test. In this stage you can also perform a user testing (asking people to perform different actions using the website and recording their comments on the ease and efficiency of the procedure)– however you have to keep in mind people’s special characteristics. For example, if all your friends are computer programmers, their comments on your websites will not necessarily reflect its usability to users who are not programmers – it all depends on what your target audience is.
- At a later stage, after you finalize your website design, feel free to use your network to promote your site in all means.
Q: can I use Facebook advertising instead of Google advertising?
A: at this point (2013) Facebook advertising doesn’t work well with randomize links (= such as the ones generated in Google content experiment) and will label you website is spam in the Facebook system. Maybe in the future it would work.
#6 – Budgeting
This experiment can be performed with a relatively low budget.
If you don’t have a domain name and a hosting package, you can check out 1&1 domain names and ipage hosting, or InMotion Hosting which are two services I found to be cost-effective/quality sufficient. Domain + hosting should not cost you more than $60 a year for a basic website.
Other expenses include:
Website design – depends on the platform that you use and if you do its in-house or outsource it. The price for a basic website can vary from $50-$5000. You can try using the Artisteer website design software – for $49 you can design as many websites as you want. There is a bit of a learning curve but the interface is very user-friendly.
Images- if you want to use images for your site you have to have legal rights to do so, you can’t simply use an image you found on Google. Luckily, there are many stock photos/stock images websites in which you can buy low-cost royalty-free images. One of the most convenient websites is www.123rf.com , in which you can find high quality royalty-free images for about$1.4 per image. In the example above I used four images, so about $6.
Google analytics – Google content experiment – free
Opentracker.net– free to try, about $20 for months afterwards
Web-stat.net – free to try and about $5-$10 a month afterwards
Advertising using Google Adwords – I paid $200 and got about 750 visitors to the websites, yet advertising costs is highly dependent on the industry, competition and product category.
Total: about $330 (including that the domain name and hosting that you would have to purchase any way for your website, even if you don’t do an optimizing ab test).
Results
After you set everything to work and got enough traffic, you can either choose the variation which Google content experiment defined as the “winner” according to the metrics you set, or export the data from opentracker.com or Web-stat.net into a statistics software and run your analysis there.
In the example above I exported the data and performed statistical analyses such as regressions, ANOVAs, and MANOVAs. The initial results suggested that I had to increase the sample size so I ran the experiment for a few additional days until I had about 1,100 visitors. Here is a summary of the insights I was able to get from the experiment:
- The presence of a Facebook like button with over 1,000 likes had no effect at all on site performance
- There was no difference in engagement related to retailer size (sites in which the product was backed up by Fitbit.com performed just as well as sites in which the product was backed up by Amazon.com)
- The homepages with infographics (= images) performed better than those with text or video (text and video performed very similar to each other)
- PC users on average spent 22 more seconds on the website than the mobile users.
Thus, the final version that was chosen had infographics for homepage, no Facebook like button, and was linked with Fitbit.com for product check out (since there was no difference in performance between Fitbit.com and Amazon.com, and the Fitbit.com affiliate program paid more).
This is not to say that these results can be generalized to all websites, they are specific to the product I chose and the variables I was testing; however I hope this gives you an overall idea of the process and what kind of insights can be gathered.
I welcome your comments, feel free to write to me if you have any additional questions or need help running your own experiment.