Roni K

Tag - Market Research

Extracting Brand Sentiments from Online Conversations

Big Brands Have To Be Careful When Listening to the Online Conversation.

Amanda says in a forum: “I have an iPhone 4. It sucks.” Her post, along with many others, is gathered by “online sentiment” robots trying to make sense out of them and give the clients (the companies and brands) some insights, like “30% of the online talk about the iPhone 4 is negative.” The question is, does this make sense? What real information can companies get out of statements such as Amanda’s? In our case, it is possible that Amanda is dissatisfied with Apple’s iPhone, but it is also possible that she is waiting to get an iPhone 5. Meantime, she has to “endure” her iPhone 4, and it sucks.

That companies want to understand what their customers think is old news. Companies have been conducting surveys among their customers and among the general public for years now, trying to get an insight into what people think about the company and its products. However, these surveys were not proven to be a real predictor of customers’ actions. For example, a customer may complain in the survey about an airline and say that the service is horrible and he’s never going to fly with it again, yet remain loyal since it’s the only company that has a direct flight on the routes he normally travels.

Extracting Brand Sentiments from Online Conversations – Challenge #1

So, the next step was to eavesdrop on consumers when they are having conversations online, and are not necessarily trying to communicate with the brand. The web is full of conversations, many of them about specific brand – on Facebook, Twitter, blogs, forums, reviews, and more. When a brand is very small, this “eavesdropping” can be done manually – a person or a team inside a company can try to constantly monitor what people are saying about the brand by simply searching for the brand name on search engines and on social websites. When the brand is larger, however, the online conversation can consist of hundreds or thousands of mentions daily – making it impossible to track them manually.

This quest to harvest the sentiment towards the brand brought on the emergence of services that claim to be able to collect large amounts of “online conversation” data about a brand and algorithmically analyze it. These services then output a number representing the brand sentiment – for example, by checking the percentages of negative and positive mentions out of all mentions in total – and giving the client reports such as: “30% positive, 20% negative and 50% neutral.”

This analysis is a challenge, since unlike human beings, who can pick up sentiment easily even from not-so-obvious sentences, algorithms have to follow a predetermined set of rules and look for specific sentiment-oriented words that are not always present in the conversation. Check, for example, this sentence: “why would Apple have this application in the iTunes Store anyway??” Put in the right context, many humans will accurately detect this to be a negative comment about a certain application. To an algorithm, however, this can appear to be a neutral statement, owing to its lack of overtly negative words.

Extracting Brand Sentiments from Online Conversations – Challenge #2

In an MSI insights article called “measuring online brand sentiment,” Julia Hannah writes about the current hot issue of trying to extract meaning out of large quantities of word-of-mouth. The paper describes a large-scale academic study by David Schweidel and Wendy Moe examining word-of-mouth sentiment across different online venues. Schweidel and Moe do not focus on the problem of an algorithm’s limited ability to understand context, they are interested instead in inherent differences in sentiment that exist across venues, products, and brand attributes.

For example, conversation venues that are more ‘one to many’ in their communication style (such as Twitter and blogs) tend to have more positive posts than venues that are more ‘many to many’ communication style (such as forums). They suggest that this “forum negativity” happens due to the fact that “when people interact with each other and respond to someone else’s opinion, there’s a tendency to differentiate and try to outdo one another by being more negative.”

Moreover, if we look at the different attributes of a product, it is very common for fans to criticize some aspects of the product while still maintaining an overall positive sentiment and positive purchase intent. One example could be “I don’t like the interface of the new speech recognition in the Galaxy 4,” or “I hate it that you can’t record your calls on the Galaxy.” The writer of this comment, even though expressing a negative opinion about the Samsung Galaxy 4, is actually only criticizing one attribute of it while still liking the overall product, and potentially being loyal to the brand.

Conclusion

Listening to online conversation is definitely necessary for successful brands these days. However, jumping to conclusions based on these conversations is dangerous. Both the theories and the software supporting extraction of online conversation sentiment are, at the moment, far from being predictive. Human involvement in these processes is still highly effective and required, and the overall best measurement of customer sentiments remains sales figures.

Can You Measure “Customer Expereince?”

customer experience

When people buy a coffee at Starbucks, they get more than just coffee. When people shop at Target, they get a different experience than when they shop at Wal-Mart. Individuals describe different experiences when using the Apple’s iPhone or Samsung’s Galaxy phone, even though the functionalities are almost the same.

Both of these examples can be attributed to customer experience, which has always been a core interest for corporations—a good customer experience leads to customer satisfaction, which then leads to customer loyalty and growth (Garg, Rahman, & Kumar, 2010).

Customer experience is a very broad and abstract concept, hence many of the definitions researchers construct lack specificity. When looking at packaged goods, for example, the customer experience often takes place out of the reach of the company, removed from the purchase location. Marketers of packaged goods create messages to convey a branded customer experience via advertising, packaging and other forms of marketing communication (Wyner, 2003).

The customer experience can be separated into a concrete component and a perceptual component; the concrete component is the physical experience created; for example, “Melanie received her package from Amazon after four days.” The perceptual components consist of elements that are harder to measure: the thoughts, feelings and attitudes created in the transaction – for example, “Melanie was pleased when the Amazon package arrived faster than she expected.” The conceptual part of the customer experience depends on countless abstract variables; among them are the customer’s expectations, the customer’s mood while engaging in the transaction, prior attitudes towards the brand, and in-store interaction. Even terms that we perceive to be quite concrete, such as “quality,” are in fact very subjective and ephemeral: “Quality” is often a measure by the extent to which the service or product delivered meets the customer’s expectations (Ghose, 2009), thus even the concept of quality is subjective and relative.

Word of Mouth: Quality over Quantity

word of mouth marketing

Humans are social creatures, and as such are influenced by others – be it friends or strangers. A few studies dating as back as 1943 suggest that communications among customers were more important than marketing communication issued by the company in influencing product adoption (Rogers, 1962; Ryan & Gross, 1943).

Marketers, aware of these findings, have since tried to harness this property to their service in their quest to create a positive attitude towards brands.

Such attempts can be seen in the use of various social endorsement avenues. Some marketers present expert testimonials to create trust and credibility; others opt for customer testimonials – either real or staged- that are said to positively enhance advertising effectiveness (Martin, Bhimy, & Agee, 2002).

In terms of positive word-of-mouth, Silverman (2001) notes, “getting people to talk often, favorably, to the right people in the right way about your product is far and away the most important thing that you can do as a marketer”. A BuzzMetrics report (Nielsen, 2012) suggests marketers to “Segment high-value customers and treat them as special ambassadors by offering them loyalty programs, member clubs, special offers and the like”, in the hope that they would spread positive word-of-mouth.

Once a customer has an experience with an organization and wants to spread word-of-mouth, the special characteristics of the Internet come to play a major role. As described above, the Internet facilitates a large reach communication channel, which allows for customers to post a message regarding their experience with the brand and instantly reach great audiences. Such large spread was hard to accomplish before the Internet era, when word-of-mouth used to spread much slower – by conversations with another individual or with a relatively small group. New social media referrals are between 20-30 times more effective at driving business than traditional marketing or media appearances (Trusov, Bucklin, & Pauwels, 2009).

This one-to-many communication by the customer becomes a many to many communication once a few individuals start speaking about the same brand – in an online forum, a talkback to an article, or a company’s Facebook page. From there, opinions and experiences can spread exponentially -social media word-of-mouth has up to 30 times larger effects than most paid marketing attempts, with a higher average carryover (Stacey, Pauwels, and Lackman, 2012).

One of the ways in which companies try to harness power of word-of-mouth over the Internet and promote users to spread it, is by placing social plug-ins. Social plug-ins are clickable elements embedded in a company’s websites that facilitate the sharing of content from the company’s websites (or word-of-mouth about it) with  the visitor’s network. While a few years ago individuals had to copy the page URL and paste it to an email message to spread it to their friends, today a simple click on an icon in the company’s websites will automatically send the message through the visitors’ favorite social network: Facebook, Twitter, Pinterest, and more.

Even though these plug-ins are efficient and ubiquitous, it is essential to remember that not all word-of-mouth is created equal. First of all, as suggested by prior studies (Godes et al., 2005; Trusov et al., 2009), a lot of the word-of-mouth communication is triggered by a specific marketing action, that should be credited – at least partially – for the surge in online conversations. Second, a study by Stacey et al. (2012) finds that Facebook likes and comments do not significantly affect purchase behavior, and increase website traffic less than topic-specific word-of-mouth conversations.

Asur and Huberman (2010) find in an extensive twitter-based research that message valence (=positive or negative emotion expressed), as opposing to quantity is highly predictive of new movie box office sales; and Chevalier and Mayzlin (2006) find that “more positive” book reviews increase sales, and not just any review. In another online word-of-mouth research the researchers focus on the inherent difference in sentiment that exist across venues, products, and brand attributes (Schweidel, Moe, & Boudreaux, 2012). For example, conversation venues that are one-to-many (such as Twitter and blogs) tend to have more positive posts than venues that are many-to-many (such as forums).

Overall, many studies  support the notion that it is not enough to look at quantity of online word-of-mouth mentions, it is crucial to analyze the content – focus on online conversation quality over quantity. Thus, evidence suggests that seeing that a page is “liked” is not enough to create actual liking and trust- visitors have to see specific content rather than something general like a social plug-in suggesting vague social endorsement.

Insights from 27 Retailers and Service Companies Website Research

Retailer website market research
  • Trend of increasing information on company ‘about us’ sections; they increased in content for almost all companies studied, with a lot of emphasis on giving back to the community and environmental issues.
  • Generally, an increase in text on all big retailer websites – could be for SEO reasons.
  • Not all transitions to new sites are smooth, even for large, resourceful companies: some sites like Expeditors or Disney seem to “sit on remains” of older sites –pages have different footers, some pages are only accessible through the site map, etc.
  • A decrease in the number of websites using “live chat” suggests the service is not cost-effective for many of them.
  • An increase in social plug-ins and social sharing options as social media continues to take a larger part in interaction with consumers.
  • Added mobile applications – almost all big retailers and service companies have signature mobile applications at this point

Does The Internet Level the Playing Field for the Small Retailers?

Many believe that the Internet levels the playing field and allows smaller retailers to setup online stores with substantially lower entrance barriers. “The virtual operation of the Internet allows merchants to enter and leave quickly and with lower investment” (Watson, Akselsen, & Pitt, 1998).

However, it appears that there is more to leveling the playing field than reducing the entrance barrier. Trust, for example, remains one of the most important components of the relationship between vendor and consumer, and gaining trust for one’s online store is not trivial. For trust to exist the retailer has to project that it has the motivation and reliability to deliver the goods as expected by the consumer (Jarvenpaa, Tractinsky, & Vitale, 2000). A large physical operation can serve as a trust cue for the consumers; it delivers the message that a large number of suppliers and clients trust the organization enough to engage in business activities (Doney & Cannon, 1997). This large physical operation is harder to project over the Internet.

In addition, the ease of entrance and exit can act as a two-way sword for online vendors. Customers are well aware of the fact that opening a store in the physical world requires large resources and investment, while an online store can be opened instantly and almost for free. According to Doney and Cannon (1997), a large retailer size assures the customer that this is not a “fly by operation” – a more challenging task in the online world where it is possible to open an online store and disappear shortly after.

In their study, Doney and Cannon (1997) find a significant positive relationship between retailer size and buying. In an Internet study by Jarvenpaa, Tractinsky, and Vitale (1999), the effects of store size on trust varies according to the product category – when buying books, store size mattered less than when buying a flight ticket. The authors attribute this difference mainly to the different cost of the products; however perceived need for future repairs, interaction and support may also be a factor.

Another issue to keep in mind is the complexity of isolating retailer size effect. By definition, bigger retailers have more visibility – either due to their physical presence or to advertising budgets, so it is very likely that they will generate more brand awareness, which can be easily confused with size. Thus, it is important to take into account that a small retailer who will be able to create larger awareness may reap similar rewards as the big retailer.

Website Optimization with A/B Testing and Multivariate Testing – Do-It-Yourself

website optimization with a b testing

This article is also available as a podcast

Considering a few different versions to your landing page? Not sure about the color of the background? Hesitating between a few options of text copy on the home page?

A multivariate test/ Ab test (a.k.a. split test, website checking) can be the answer for you. With ab testing you don’t have to shoot in the dark; you can perform a test to optimize your website even with a small budget, and find which version of your website performs best.

There are several platforms in the market that offer a one-stop-shop to a/b and multivariate testing, and most of them are not cheap, so in this post I will describe how to do it yourself to avoid these costs.

The do-it-yourself method uses Google content experiment as the test platform for either ab testing or multivariate testing and is free – the only costs associated with the tests described below are the costs of designing and operating the website and the cost of getting website traffic (bringing visitors to the site). In addition to minimizing costs, you will also learn a lot from the process of running such a test on your own.

The experiment phases are roughly the following: define goals and metrics, choose variables of interest, design the website and experiment, execute and collect the data, analyze, derive conclusions.

Follow the steps below to create an awesome A/B or multivariate experiment:

#1 – Define Goals and Metrics

How will you know which design/website version is the best?

You have to define goals according to what you want people to do on the site. For example, do you want people to subscribe to newsletter? Purchase a product? Do you want to maximize number of pages viewed per visit? Maximize time on site?

It is important to define these metrics well since this is a live, online experiment, and we cannot ask visitors to describe their website experience. We rely on tracking software to provide information regarding the behavior of the visitors on site. This information later allows us to compare the behavior between the different variations, but we need to be very clear about what’s we are measuring. Think about it – if your goal is to make a sale, do you really care how much time people spend in your site if they didn’t purchase anything?

Some metrics that you can look at are:

  • Time spent on page
  • Number of pages viewed
  • Click on the purchase link/checkout
  • Add item to shopping cart
  • Subscribe to newsletter
  • Share article
  • Like page
  • And more

You can also record data about the visitors such as time, region, browser, device, and in some cases – additional demographic details.

#2 – Variable Choice

Choosing variables is one of the hardest parts of the experiment planning; each website contains countless elements that could be affecting the visitor experience. Since testing all the elements present in a website can take forever, you have to come up with your priorities and variables of interest.

Even though you should decide on the variables before starting to build the websites and running the experiment, keep an open mind and be willing to change things on the go. When data starts flowing in, you may realize that some variables you chose provide little insight, while other elements you didn’t include hint at interesting results.

There are infinite options for variables to test. Some ideas are:

  1. Background color/design
  2. Different titles/slogans
  3. Different text copy
  4. Different settings of elements inside of the page
  5. Social endorsement icons
  6. Presence of a video
  7. Flash versus HTML


#3 – Website Design

After you planned the experiment and chose variables it is time to design the websites.

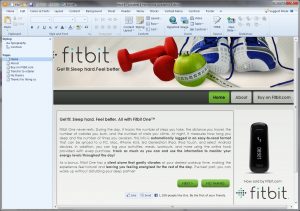
It is important to make sure that other than our special variations, the design of the website remains standard and appealing to the visitor. There are many tools and platforms out there for website creation with varying degrees of flexibility, I suggest you do your own research and find the software that matches your technical skills. One suggestion for a very intuitive website design software is Artisteer. A trial version can be downloaded here.

Artisteer for ab testing and multivariate testing

Designing my sites with Artisteer website design software


Let’s look at an example of what I mentioned so far, so you best understand how to design the different versions of the site.

Say that I’m interested in testing the effect of the following variables on visitor engagement:

  1. The main element on the landing page: text versus video versus image on the home page.
  2. The size of product seller – big/small (this is an affiliate website which leads to a checkout page for the product on either Amazon.com or Fitbit.com, Amazon.com is obviously the big famous retailer)
  3. The presence of a Facebook like button showing over 1,000 likes for the product.

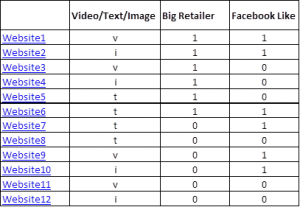
This choice of variables dictates building 12 websites, as described in the table below. 3X2X2=12 : three variations for main element of landing page, to variations for retailer size, to variations for presence or absence of a Facebook like button.

ab testing and multivariate testing planning table

As described in the table, I designed 12 websites using Artisteer software. Each website is a slight variation of the other. Here are a few samples, click on any of the images below to enlarge the variation.

#4 – Tracking Website Visitors

In order to follow visitors’ behavior on the website, I worked with three tracking services, each one complementing the other: Google analytics, opentracker.com, and Web-stat.net. Each of these services provides a tracking code that is then implemented into the HTML files of the site after the design is ready. Adding the code is pretty straightforward and is explained on each one of the tracking platforms after you open an account.

Google analytics is good if you’re looking for overall performance and don’t care too much about statistical validity, but is very limited if you want to run your own statistical analysis with the data and need the records of each specific visit (this is because of current privacy settings in Google).

Opentracker web tracking tool for ab and multivariate testing

Opentracker web tracking tool


If you’re interested in performing a more professional statistical analysis (recommended) that will check if the results you’re getting are significant at all, you need to collect individual website visit stats. Both Opentracker and Web-stat provide detailed individual visitor stats – as well as click paths (=the exact sequence of clicks a visitor goes through in your website). An even more advanced option is Clicktale, a service that actually records each movement of the courser, scrolling, etc. and provides a heat map, showing you what parts of the landing page page were most visible to your visitors.

After pasting the tracking codes into the site’s HTML, I uploaded the website files to my hosting server. To check that the tracking codes work, I visited each one of the 72 experiment pages (each website had six pages, thus 6X12=72), and logged in to the tracking software to verify that all my visits were tracked.

After verifying that the tracking code works well, the next step is to get visitors to all the different sites.

#5 – Getting Website Visitors to All the Variations

The fastest way to bring “real” website traffic is through online advertising campaign. A common one to use is the Google search / display network advertising, but there are other options available through Yahoo, Bing, and more.

Those ads, a.k.a Adwords appear when relevant queries are typed into search engines, or in text boxes in relevant websites. You pay only when a visitor clicks on the ad and gets to your website (this advertising system is known as known as PPC, or pay per click). There are plenty of AdWords tutorials on the AdWords website and on YouTube, check them out when you are ready to start bringing traffic to your website.

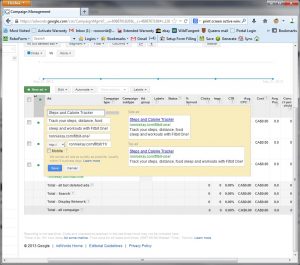
Below is a screenshot of the AdWords ad I used for the sample:

google-experiment-ad

Since we have 12 different websites, we want to be able to send visitors to 12 different URLs. How do we do that?

There are two main methods to do this:

The first method is to create 12 ads which are identical in content, but each one leads to a different URL. In campaign settings, choose the option of “rotate ads evenly”, which will ensure that the ads will be served approximately equally. This however, does not ensure that the number of clicks will be even – it is possible that by chance one of the ads will be clicked more than the other. This limitation is eliminated by the second method – opening a Google experiment.

A Google content experiment allows you to randomize the page to which the visitors arrive. Simply put, you show all of the visitors a URL that leads to “websites 1”, but Google randomizes the page they actually see – some of them will see “websites 2”, some will see “website 7”, etc. A cookie will be stored in the visitor’s browser ensuring that each visitor always sees the same page if they later returned to the site.

In addition to randomizing the sites, Google content experiment allows you to set specific targets to compare the different website variations, using metrics such as: predefined conversions, number of pages viewed, time on site, etc. You can define, for example, that a visitor who spent more than 60 seconds on your site is considered to be a “success” and Google content experiment will compare the different variations according to this metric.

Using this method requires adding a few more lines of HTML to the website, yet the code is fully provided by Google and you just have to copy and paste it into the site’s homepage.

Q: should I use my twitter/Facebook/email to promote the site and get visitors without paying for a service like Google AdWords?

A: at this point absolutely not. You want to the get real reaction of visitors – people who don’t know you, don’t care about you, and are judging your product through what they see on your webpage. Thus, sending your site to people you know could be beneficial only in one of two stages:

  • Before you conduct the experiment, you show the website to a few people and ask them what they think. You can use their answers to plan the experiment’s variables. For example, if one person tells you that the background should be black and another person says that the background should be orange, you can use these two suggestions as variations in your test. In this stage you can also perform a user testing (asking people to perform different actions using the website and recording their comments on the ease and efficiency of the procedure)– however you have to keep in mind people’s special characteristics. For example, if all your friends are computer programmers, their comments on your websites will not necessarily reflect its usability to users who are not programmers – it all depends on what your target audience is.
  • At a later stage, after you finalize your website design, feel free to use your network to promote your site in all means.

Q: can I use Facebook advertising instead of Google advertising?

A: at this point (2013) Facebook advertising doesn’t work well with randomize links (= such as the ones generated in Google content experiment) and will label you website is spam in the Facebook system. Maybe in the future it would work.

#6 – Budgeting

This experiment can be performed with a relatively low budget.

If you don’t have a domain name and a hosting package, you can check out 1&1 domain names and ipage hosting, or InMotion Hosting which are two services I found to be cost-effective/quality sufficient. Domain + hosting should not cost you more than $60 a year for a basic website.

Other expenses include:

Website design – depends on the platform that you use and if you do its in-house or outsource it. The price for a basic website can vary from $50-$5000. You can try using the Artisteer website design software – for $49 you can design as many websites as you want. There is a bit of a learning curve but the interface is very user-friendly.

Images- if you want to use images for your site you have to have legal rights to do so, you can’t simply use an image you found on Google. Luckily, there are many stock photos/stock images websites in which you can buy low-cost royalty-free images. One of the most convenient websites is www.123rf.com , in which you can find high quality royalty-free images for about$1.4 per image. In the example above I used four images, so about $6.

Google analytics – Google content experiment – free

Opentracker.net– free to try, about $20 for months afterwards

Web-stat.net – free to try and about $5-$10 a month afterwards

Advertising using Google Adwords – I paid $200 and got about 750 visitors to the websites, yet advertising costs is highly dependent on the industry, competition and product category.

Total: about $330 (including that the domain name and hosting that you would have to purchase any way for your website, even if you don’t do an optimizing ab test).

Results

After you set everything to work and got enough traffic, you can either choose the variation which Google content experiment defined as the “winner” according to the metrics you set, or export the data from opentracker.com or Web-stat.net into a statistics software and run your analysis there.

In the example above I exported the data and performed statistical analyses such as regressions, ANOVAs, and MANOVAs. The initial results suggested that I had to increase the sample size so I ran the experiment for a few additional days until I had about 1,100 visitors. Here is a summary of the insights I was able to get from the experiment:

  • The presence of a Facebook like button with over 1,000 likes had no effect at all on site performance
  • There was no difference in engagement related to retailer size (sites in which the product was backed up by Fitbit.com performed just as well as sites in which the product was backed up by Amazon.com)
  • The homepages with infographics (= images) performed better than those with text or video (text and video performed very similar to each other)
  • PC users on average spent 22 more seconds on the website than the mobile users.

Thus, the final version that was chosen had infographics for homepage, no Facebook like button, and was linked with Fitbit.com for product check out (since there was no difference in performance between Fitbit.com and Amazon.com, and the Fitbit.com affiliate program paid more).

This is not to say that these results can be generalized to all websites, they are specific to the product I chose and the variables I was testing; however I hope this gives you an overall idea of the process and what kind of insights can be gathered.

I welcome your comments, feel free to write to me if you have any additional questions or need help running your own experiment.


Podcast: Optimizing Your Website with A/B Testing and Multivariate Testing

Hesitating between a few different versions to your home page? Not sure about the the background? Considering different options of text copy on the landing page? An A/B test or a A multivariate test (a.k.a. split test, website checking) can be the answer for you. Learn how to perform the ultimate optimization to your website with a small budget.

Want to read it instead? Scroll down for full transcription.

Links to software and services mentioned in the podcast:

Article: Optimizing Your Website with A/B Testing and Multivariate Testing

Considering a few different versions to your landing page? Not sure about the color of the background? Hesitating between a few options of text copy on the home page?

A multivariate test or an A/B test (a.k.a. split test, website checking) can be the answer for you. With AB testing you don’t have to shoot in the dark; you can perform a test to optimize your website even with a small budget, and find which version of your website performs best.

There are several platforms in the market that offer a one-stop-shop to a/b and multivariate testing, and most of them are not cheap, so in this post I will describe how to do it yourself to avoid these costs.

The do-it-yourself method uses Google content experiment as the test platform for either ab testing or multivariate testing and is free – the only costs associated with the tests described below are the costs of designing and operating the website and the cost of getting website traffic (bringing visitors to the site). In addition to minimizing costs, you will also learn a lot from the process of running such a test on your own.

The experiment phases are roughly the following: define goals and metrics, choose variables of interest, design the website and experiment, execute and collect the data, analyze, derive conclusions.

Follow the steps below to create an awesome A/B or multivariate experiment:

#1 – Define Goals and Metrics

How will you know which design/website version is the best?

You have to define goals according to what you want people to do on the site. For example, do you want people to subscribe to newsletter? Purchase a product? Do you want to maximize number of pages viewed per visit? Maximize time on site?

It is important to define these metrics well since this is a live, online experiment, and we cannot ask visitors to describe their website experience. We rely on tracking software to provide information regarding the behavior of the visitors on site. This information later allows us to compare the behavior between the different variations, but we need to be very clear about what’s we are measuring. Think about it – if your goal is to make a sale, do you really care how much time people spend in your site if they didn’t purchase anything?

Some metrics that you can look at are:

  • Time spent on page
  • Number of pages viewed
  • Click on the purchase link/checkout
  • Add item to shopping cart
  • Subscribe to newsletter
  • Share article
  • Like page
  • And more

You can also record data about the visitors such as time, region, browser, device, and in some cases – additional demographic details.

#2 – Variable Choice

Choosing variables is one of the hardest parts of the experiment planning; each website contains countless elements that could be affecting the visitor experience. Since testing all the elements present in a website can take forever, you have to come up with your priorities and variables of interest.

Even though you should decide on the variables before starting to build the websites and running the experiment, keep an open mind and be willing to change things on the go. When data starts flowing in, you may realize that some variables you chose provide little insight, while other elements you didn’t include hint at interesting results.

There are infinite options for variables to test. Some ideas are:

  1. Background color/design
  2. Titles/slogans
  3. Text copy
  4. Settings of elements inside of the page
  5. Social endorsement icons
  6. Presence of a video
  7. Flash versus HTML


#3 – Website Design

After you planned the experiment and chose variables it is time to design the websites.

It is important to make sure that other than our special variations, the design of the website remains standard and appealing to the visitor. There are many tools and platforms out there for website creation with varying degrees of flexibility, I suggest you do your own research and find the software that matches your technical skills. One suggestion for a very intuitive website design software is Artisteer. A trial version can be downloaded here.

Designing my sites with Artisteer website design software

Let’s look at an example of what I mentioned so far, so you best understand how to design the different versions of the site.

Say that I’m interested in testing the effect of the following variables on visitor engagement:

  1. The main element on the landing page: text versus video versus image on the home page.
  2. The size of product seller – big/small (this is an affiliate website which leads to a checkout page for the product on either Amazon.com or Fitbit.com, Amazon.com is obviously the big famous retailer)
  3. The presence of a Facebook like button showing over 1,000 likes for the product.

This choice of variables dictates building 12 websites, as described in the table below. 3X2X2=12 : three variations for main element of landing page, to variations for retailer size, to variations for presence or absence of a Facebook like button.


ab testing and multivariate testing planning table

ab testing and multivariate testing planning table

As described in the table, I designed 12 websites using Artisteer software. Each website is a slight variation of the other. Here are a few samples, click on any of the images below to enlarge the variation.

#4 – Tracking Website Visitors

In order to follow visitors’ behavior on the website, I worked with three tracking services, each one complementing the other: Google analytics, opentracker.com, and Web-stat.net. Each of these services provides a tracking code that is then implemented into the HTML files of the site after the design is ready. Adding the code is pretty straightforward and is explained on each one of the tracking platforms after you open an account.

Google analytics is good if you’re looking for overall performance and don’t care too much about statistical validity, but is very limited if you want to run your own statistical analysis with the data and need the records of each specific visit (this is because of current privacy settings in Google).

web tracking tool

web tracking tool


If you’re interested in performing a more professional statistical analysis (recommended) that will check if the results you’re getting are significant at all, you need to collect individual website visit stats. Both Opentracker and Web-stat provide detailed individual visitor stats – as well as click paths (=the exact sequence of clicks a visitor goes through in your website). An even more advanced option is Clicktale, a service that actually records each movement of the courser, scrolling, etc. and provides a heat map, showing you what parts of the landing page page were most visible to your visitors.

After pasting the tracking codes into the site’s HTML, I uploaded the website files to my hosting server. To check that the tracking codes work, I visited each one of the 72 experiment pages (each website had six pages, thus 6X12=72), and logged in to the tracking software to verify that all my visits were tracked.

After verifying that the tracking code works well, the next step is to get visitors to all the different sites.

#5 – Getting Website Visitors to All the Variations

The fastest way to bring “real” website traffic is through online advertising campaign. A common one to use is the Google search / display network advertising, but there are other options available through Yahoo, Bing, and more.

Those ads, a.k.a Adwords appear when relevant queries are typed into search engines, or in text boxes in relevant websites. You pay only when a visitor clicks on the ad and gets to your website (this advertising system is known as known as PPC, or pay per click). There are plenty of AdWords tutorials on the AdWords website and on YouTube, check them out when you are ready to start bringing traffic to your website.

Below is a screenshot of the AdWords ad I used for the sample:

google experiment ad

google experiment ad

Since we have 12 different websites, we want to be able to send visitors to 12 different URLs. How do we do that?

There are two main methods to do this:

The first method is to create 12 ads which are identical in content, but each one leads to a different URL. In campaign settings, choose the option of “rotate ads evenly”, which will ensure that the ads will be served approximately equally. This however, does not ensure that the number of clicks will be even – it is possible that by chance one of the ads will be clicked more than the other. This limitation is eliminated by the second method – opening a Google experiment.

A Google content experiment allows you to randomize the page to which the visitors arrive. Simply put, you show all of the visitors a URL that leads to “websites 1”, but Google randomizes the page they actually see – some of them will see “websites 2”, some will see “website 7”, etc. A cookie will be stored in the visitor’s browser ensuring that each visitor always sees the same page if they later returned to the site.

In addition to randomizing the sites, Google content experiment allows you to set specific targets to compare the different website variations, using metrics such as: predefined conversions, number of pages viewed, time on site, etc. You can define, for example, that a visitor who spent more than 60 seconds on your site is considered to be a “success” and Google content experiment will compare the different variations according to this metric.

Using this method requires adding a few more lines of HTML to the website, yet the code is fully provided by Google and you just have to copy and paste it into the site’s homepage.

Q: should I use my twitter/Facebook/email to promote the site and get visitors without paying for a service like Google AdWords?

A: at this point absolutely not. You want to the get real reaction of visitors – people who don’t know you, don’t care about you, and are judging your product through what they see on your webpage. Thus, sending your site to people you know could be beneficial only in one of two stages:

  • Before you conduct the experiment, you show the website to a few people and ask them what they think. You can use their answers to plan the experiment’s variables. For example, if one person tells you that the background should be black and another person says that the background should be orange, you can use these two suggestions as variations in your test. In this stage you can also perform a user testing (asking people to perform different actions using the website and recording their comments on the ease and efficiency of the procedure)– however you have to keep in mind people’s special characteristics. For example, if all your friends are computer programmers, their comments on your websites will not necessarily reflect its usability to users who are not programmers – it all depends on what your target audience is.
  • At a later stage, after you finalize your website design, feel free to use your network to promote your site in all means.

Q: can I use Facebook advertising instead of Google advertising?

A: at this point (2013) Facebook advertising doesn’t work well with randomize links (= such as the ones generated in Google content experiment) and will label you website is spam in the Facebook system. Maybe in the future it would work.

#6 – Budgeting

This experiment can be performed with a relatively low budget.

If you don’t have a domain name and a hosting package, you can check out 1&1 domain names and ipage hosting, or InMotion Hosting which are two services I found to be cost-effective/quality sufficient. Domain + hosting should not cost you more than $60 a year for a basic website.

Other expenses include:

Website design – depends on the platform that you use and if you do its in-house or outsource it. The price for a basic website can vary from $50-$5000. You can try using the Artisteer website design software – for $49 you can design as many websites as you want. There is a bit of a learning curve but the interface is very user-friendly.

Images- if you want to use images for your site you have to have legal rights to do so, you can’t simply use an image you found on Google. Luckily, there are many stock photos/stock images websites in which you can buy low-cost royalty-free images. One of the most convenient websites is www.123rf.com , in which you can find high quality royalty-free images for about$1.4 per image. In the example above I used four images, so about $6.

Google analytics – Google content experiment – free

Opentracker.net– free to try, about $20 for months afterwards

Web-stat.net – free to try and about $5-$10 a month afterwards

Advertising using Google Adwords – I paid $200 and got about 750 visitors to the websites, yet advertising costs is highly dependent on the industry, competition and product category.

Total: about $330 (including that the domain name and hosting that you would have to purchase any way for your website, even if you don’t do an optimizing ab test).

Results

After you set everything to work and got enough traffic, you can either choose the variation which Google content experiment defined as the “winner” according to the metrics you set, or export the data from opentracker.com or Web-stat.net into a statistics software and run your analysis there.

In the example above I exported the data and performed statistical analyses such as regressions, ANOVAs, and MANOVAs. The initial results suggested that I had to increase the sample size so I ran the experiment for a few additional days until I had about 1,100 visitors. Here is a summary of the insights I was able to get from the experiment:

  • The presence of a Facebook like button with over 1,000 likes had no effect at all on site performance
  • There was no difference in engagement related to retailer size (sites in which the product was backed up by Fitbit.com performed just as well as sites in which the product was backed up by Amazon.com)
  • The homepages with infographics (= images) performed better than those with text or video (text and video performed very similar to each other)
  • PC users on average spent 22 more seconds on the website than the mobile users.

Thus, the final version that was chosen had infographics for homepage, no Facebook like button, and was linked with Fitbit.com for product check out (since there was no difference in performance between Fitbit.com and Amazon.com, and the Fitbit.com affiliate program paid more).

This is not to say that these results can be generalized to all websites, they are specific to the product I chose and the variables I was testing; however I hope this gives you an overall idea of the process and what kind of insights can be gathered.

I welcome your comments, feel free to write to me if you have any additional questions or need help running your own experiment.


How to Find Keyword Ideas Using Google Keyword Planner

Keyword ideas

I often find that business owners and individuals have a hard time identifying relevant keywords for HootSuite searches and for their business communications in general. Finding keywords often requires thinking out of the box, and this is especially hard if you’re thinking of your own business! For example, if you own a snow removal business, you’ve been conditioned to think of what you do as “snow removing” and not as “snowplowing.” It is possible, however, that some of your potential clients are looking for snowplowing, and if your competitors know that and you don’t, they are a step ahead of you in the game.

How to Find the Keywords That Are Relevant to Your Business

  • Open an account with Google AdWords: http://adwords.google.com/
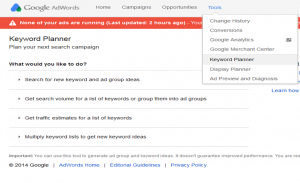
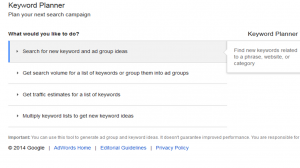
  • Go to Tools > Keyword Planner (formerly Google keyword tool)
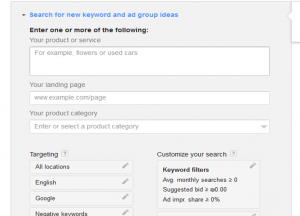
  • Click on “Search for new keyword and group ideas”

  • Type in the relevant phrase – the words you use to define your business. Alternatively you can type in the URL of a relevant page from your website, preferably one that lists your services or explains what you do. Google will scan the page and will give suggestions accordingly. I recommend trying it both ways – once with the keywords and once with the URL.

  • Consider targeting your keyword results – you can narrow results based on language, location, etc.
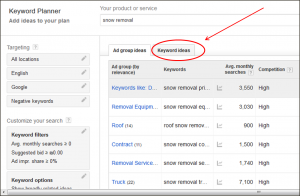
  • Hit “get ideas”, choose keyword ideas, and look at the list that comes up.

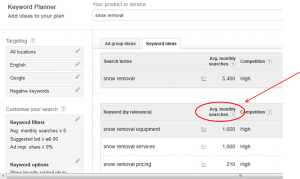
  • Browsing the list will give you a pretty good idea of what people are looking for/thinking of, that’s related to your business. If you want to sort the list by volume (see the most frequently searched for keywords first), click on average monthly searches.

  • Make a list of “negative keywords” for future use. For example, if your company offers snow removal as a service, you will see that some of the results that come up deal with “snow removal equipment”. Add “equipment” to your negative keywords list to further narrow your search in HootSuite – in your search stream, you will ask HootSuite to return results related to “snow removal” that do not contain the word “equipment.”

To sum up, finding relevant keywords is important not only for search engine optimization (SEO) and  meta tags – it is also important in your HootSuite strategy, especially when looking for competitors, industry trends, and thinking strategically about your business communications.


Location-based Search on HootSuite

tel aviv bugrashov beach

The location-based search tool on HootSuite is one of the most valuable search features, and is especially useful if:

  • You are running a local business
  • You are looking for a job in a specific area
  • You are interested in local events and news about your community


Setting up a Geo search is easy. Here is how you can do it:

  • Go to HootSuite dashboards > add stream > Twitter > search
  • Type in your search term
  • Click on the little Geo icon to make your search local.

location based search on hootsuite

  • Your browser will ask you if you are willing to share your location with HootSuite. If you click allow, the search box will automatically be populated with the coordinates of your current location.
  • Once you click “add stream,” the stream will be created showing you results relevant to your search query in a radius of 25 km from your location.

How to Adjust Your Geo Search Parameters

  • To switch from kilometers to miles, simply replace the “km” at the end of the geocode with “mi”.
  • To change the required distance, you can write any number you want instead of the default “25” kilometers.

location based search on hootsuite

Get Results for a Location That Is Not Your Current Location

Let’s say that you are traveling to Barcelona and want to find out about events in the city through Twitter before getting there.

  • Go to Google maps and look for the address you are interested in – it could be for example the address of the hotel you will be staying in.
  • Click on the location showed on the map (mostly denoted by the letter A or B). Click on “what’s here” to copy the coordinates you found.
  • Insert these coordinates instead of the ones showing by default in your search box.

Social Listening Using HootSuite

Social listening and social media listening using hootsuite

One of the most valuable practices you can engage in with HootSuite is social listening, or social media listening, a.k.a social media monitoring or tracking. I would argue that it is perhaps even more important than “broadcasting” your message. Listening to what is out there, what customers are saying about your brand, can help you understand what kind of content you should share with them.

In this article I will share with you how you can use this powerful tool to get business intelligence, follow your competitors, and listen to your customers.

Engage and Monitor through Mentions Streams

Mentions streams are pretty straightforward. You can easily add a Twitter stream that will display all tweets mentioning your username. Having this stream helps you to easily engage with Twitter users who mention you without missing any of their tweets. However, relying solely on mentions streams can be a problem since:

  1. If customers are saying something negative about you, they will not necessarily want to communicate it directly to you -they might not use your Twitter handle when displaying a negative message (unless they are actually interested in getting your response)
  2. Customers may be mentioning you without even thinking / knowing that you have a Twitter handle, so they are talking about you without using it.

That is why using keyword and search streams are so important.

What Is the Difference between Keywords and Search Streams?

Keywords allows you to define specific words that you want to track, while search takes advantage of the Twitter search engine which involves an elaborate algorithm that takes into account factors such as searcher’s previous behavior, synonyms, influence, and more.

At the moment the keyword stream is only available for Twitter, while search is available for other social platforms on HootSuite as well.

Keyword Streams

Keyword streams search all Twitter content. You can use them to:

  • Find out what your customers are saying about you
  • Keep up with your industry
  • Look for a job
  • Follow topics that interest you

To add such as stream go to HootSuite dashboards > add stream > Twitter > keyword

A few examples of how you can use keyword streams:

  • If you have a real estate company in Toronto, you can use a few variations of the term “Toronto rentals” in order to cover as many related searches, for example Toronto Rentals, torontorentals, Toronto rent, etc.
  • For personal use – prepare searches regarding topics that interest you, for example: fitness tips, recipes, deals of all sorts: travel deals, freebies, etc., NFL updates, productivity tips.
  • You can use keyword streams to stay on top of your industry
  • Create keyword searches that deal with jobs in your area, recruiters and HR professionals

Click here to learn more about generating keyword ideas.

Note: HootSuite asks you to choose a profile, but as of January 2013 it doesn’t really matter, you will get same keyword results for your different Twitter profiles.

Search Streams

Add a search stream by going to HootSuite dashboards > add stream >Twitter/Facebook/Google +/else > Search. A few things you can try:

  • Use hashtags (#)
  • Compare searches with and without #
  • Click on “show examples” to get ideas for advanced search tactics
  • For example, use OR between alternate words , quotation marks to “lock the entire phrase”, etc.

I suggest that you experiment by adding all the streams mentioned above, so you get the feel for them and see which ones are most beneficial for you. Once you feel comfortable with these, your next step is to learn about advanced search tactics.

Using mentions, keyword, and search streams strategically will enable you to take full advantage of HootSuite as a social media management tool, and will help with your reputation management and CRM efforts.